PropNex Picks
|April 23,2025Resale Condo Market Watch in March 2025
Share this article:
Slump in resale profits despite rebound in resale condo activity in March

Sales momentum in the resale condo market rallied in March, with 1,005 condo units worth nearly $2 billion being resold during the month - compared with the 970 resale transactions valued at $1.89 billion transacted in February.
The pick-up in resale market activity could have been spurred by the healthy momentum in the new launch market, which may have helped to stoke overall buying interest. In March, new sales transactions accounted for just 40% of non-landed transactions, while resale transactions accounted for more than half of transactions (56%, see Chart 1).
Chart 1: Proportion of private non-landed transactions (excl. EC) by sale type by month
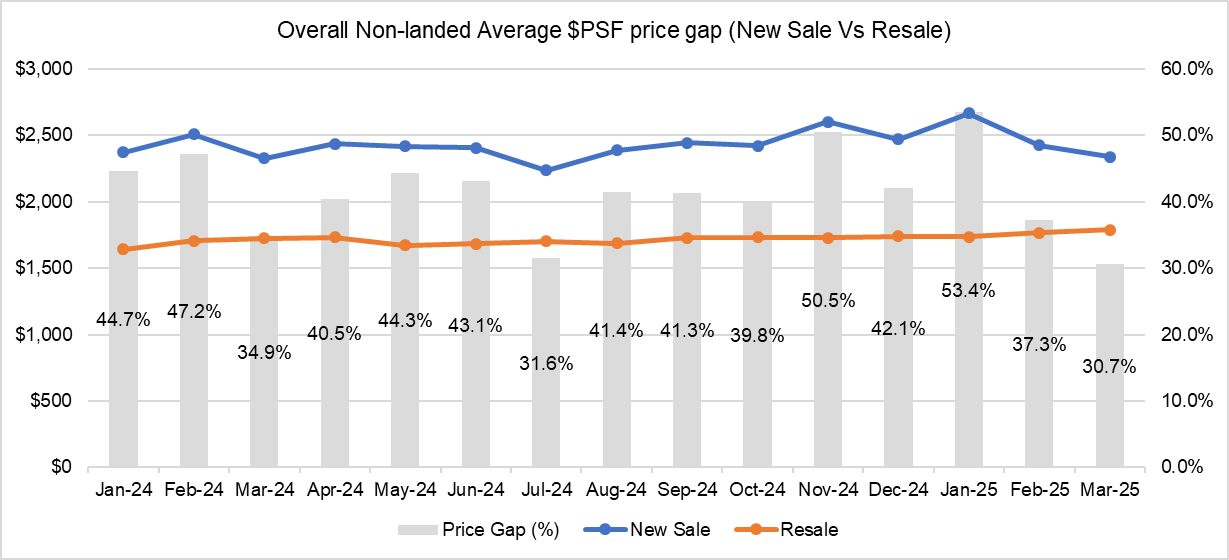
In spite of the robust activity in the new launch market, the average unit price of new non-landed homes sold dipped for the second consecutive month due to the larger proportion of mass market homes transacted. The average new sales price fell by 3.6% month-on-month (MOM) to $2,338 psf in March, while the average resale unit price inched up by 1.3% MOM. As such, the new sale and resale price gap narrowed further to 30.7% in March (see Chart 2). This is the narrowest the new sale-resale price gap has been since June 2020 when it stood at 13.3%.
Chart 2: New sale and Resale Price gap of non-landed homes (overall) by month
Decline in profitability and more loss-makers
In terms of profitability, resale condo units transacted in March saw a slight decline in gains compared with the previous month. Analysing the profits reaped by resale non-landed private homes in February and March 2025, it was found that resale condo deals garnered slightly lower profits, and the number of loss-making transactions crept up in March 2025 over the previous month. The resale profit analysis involves computing gains achieved for the units by matching the condo resale transactions in March against their respective previous purchase price, according to caveats lodged.
The study showed that 14% of resale condo transactions (135 deals) in March made more than $1 million in profits, compared with 14.8% in February. Of these million-dollar profit-making deals, a substantial portion (39.3%) came from the city fringe or Rest of Central Region (RCR), followed by Outside Central Region (OCR) homes (31%) and Core Central Region (CCR) homes (29.6%). Loss-making deals in March accounted for 4.7% of transactions, inching up from the 3.5% in February (see Chart 3).
Chart 3: Proportion of profit quantum of resale non-landed transactions (Feb 2025 vs Mar 2025)
The average profit was subsequently computed on a project basis. To minimise sampling errors, resale condominium projects that posted fewer than five transactions during the month are excluded from the study. Based on URA Realis caveat data analysed by PropNex Research, the most profitable condo in the CCR, was Martin Modern in District 9, which pulled in an average profit of more than $595,300 across five transactions in March.
Top Resale Condo projects^ in terms of average gross profit* by region (March 2025)
Project Name | No. of transactions | Average Profit Gained ($) | Average Annualised Profit (%)# | Year completed | District |
CCR | |||||
| MARTIN MODERN | 5 | $595,314 | 3.3% | 2021 | 9 |
| D'LEEDON | 6 | $448,440 | 2.7% | 2014 | 10 |
| THE SAIL @ MARINA BAY | 8 | $29,970 | 0.4% | 2008 | 1 |
RCR | |||||
| THE INTERLACE | 5 | $820,242 | 3.2% | 2013 | 4 |
| PRINCIPAL GARDEN | 7 | $640,857 | 3.9% | 2018 | 3 |
| DOVER PARKVIEW | 7 | $621,588 | 4.9% | 1997 | 5 |
OCR | |||||
| COSTA DEL SOL | 5 | $850,900 | 4.3% | 2003 | 16 |
| THE PANORAMA | 5 | $664,277 | 6.2% | 2017 | 20 |
| THE MINTON | 6 | $628,400 | 5.6% | 2013 | 19 |
In the RCR, the most profitable condo development in March was The Interlace, a project located in District 5, which achieved an average profit of over $820,000, across five transactions. In the heartlands or Outside Central Region (OCR), the most profitable project was Costa Del Sol in District 16 (Bedok, Upper East Coast) which garnered an average profit of $850,000 across five transactions. Costa Del Sol was also the overall best performing project in terms of average profit quantum in March.
Going by districts, resale homes in District 21 (Clementi, Bukit Timah) raked in the highest profits on quantum basis, with transactions reaping average gains of nearly $883,000 per deal. In terms of annualised gains, resale homes in District 20 (Ang Mo Kio, Bishan) enjoyed an average annualised profit of 5.2% per deal.
Top 10 Resale Condo districts^ in terms of average gross profit* (March 2025)
District | No. of transactions** | Average Gains ($) | Average Annualised Gains (%)# |
D21 | 21 | $882,676 | 4.5% |
D10 | 65 | $814,435 | 2.6% |
D15 | 73 | $780,060 | 4.3% |
D20 | 41 | $765,396 | 5.2% |
D11 | 21 | $690,517 | 3.1% |
D22 | 15 | $568,371 | 4.3% |
D16 | 55 | $547,864 | 3.9% |
D5 | 67 | $528,807 | 4.2% |
D9 | 65 | $519,624 | 1.8% |
D23 | 55 | $510,551 | 3.7% |
Analysing individual transactions by gross profit quantum, it was found that the top five gainers from each region ranged from $1.69 million to $6.37 million. The units which chalked up bigger gains were mostly sizeable large format condos that are more than 1,300 sq ft in size, and consisted mostly of older projects built in the 1980s to early 2000s. The respective holding periods for the most profitable resale properties were mostly beyond 10 years - the oldest being a unit held for nearly 26 years.
Top 5 Resale Condo transactions in March 2025 by gross profit by region
It was found that the overall most profitable transaction and top gainer in the CCR was for an 11th floor unit at The Claymore. It was resold for an estimated profit of $6.37 million, reflecting an annualised profit of 3.3%. Based on URA Realis caveat data, the 3,348-sq ft unit was first bought in October 1999 and subsequently resold for $11.38 million in March 2025, with a holding period of 25 years. The freehold project in Newton was built in 1985, and it is situated close to Orchard Road.
The top gainer in the RCR in terms of gross profit was for unit transacted at Cote D'Azur in District 15, which fetched a gross profit of nearly $2.2 million (annualised profit of 5.3%), based on caveats lodged. The 1,539-sq ft 12th floor apartment was sold for $3.18 million, with a holding period of more than 22 years. The 99-year leasehold project in Marine Parade was built in 2004, and it is near to the Marine Parade MRT station on the Thomson-East Coast Line (TEL). Meanwhile, the surrounding commercial amenities include Parkway Parade Shopping Centre, Marine Parade Central Market and Food Centre, i12 Katong mall, as well as the East Coast Park.
Over in the OCR, the top gainer in March was a 5th floor unit located in Varsity Park Condominium in District 4. The 2,153-sq ft unit was sold for over $2.9 million, achieving an estimated profit of more than $2 million - which reflects an annualised profit of 6.6% over a holding period of about 18 years. The 99-year leasehold project was built in 2008 and it is located near to the National University of Singapore (NUS) and West Coast Park.
With rising new launch prices, condo resellers may stand to benefit as some homebuyers may find themselves priced out of the new launch market and could consider options in the resale segment. That said, resale gains may potentially see some moderation, particularly amidst the geopolitical tensions and uncertainties around how interest rates will move in the near-term.
Views expressed in this article belong to the writer(s) and do not reflect PropNex's position. No part of this content may be reproduced, distributed, transmitted, displayed, published, or broadcast in any form or by any means without the prior written consent of PropNex.
For permission to use, reproduce, or distribute any content, please contact the Corporate Communications department. PropNex reserves the right to modify or update this disclaimer at any time without prior notice.